As I mentioned elsewhere, in my free time I’m working on a PHP-based program to analyze the stock market and choose which stocks to trade. The idea being to run a basic trading method against all stocks, rank them based on results and success and then buy one of the top results the program spits out at me.
The program so far
I’ve been working on my program, for the moment codenamed Gnosis, since April. I started paper-trading around a month ago, starting with a “budget” of $2,500. So far things haven’t been going so well, as my simulated portfolio is down almost 16%. On the plus side, however, 5 of the 15 stocks I’ve traded thus far have been great successes. One of them even netted me an almost 18% gain.
Right now, my program is analyzing all stocks across the AMEX, NASDAQ, NYSE and OTCBB markets, on equal footing. Yes, that means I’m analyzing over 20,000 available stocks. However, I need to start setting up parameters to reduce the amount of analysis going on, as there are some stocks that will clearly never yield good results, or that just aren’t good for swing trading (for example, stocks with such little volume that their price changes once or twice a month).
So once I wrap up the current line of work I’m doing right now, I’ll be doing some house-cleaning in the code and adding these restrictions. Key among those restrictions will be volume, I need to determine what would be a good average daily volume for a stock to have to make it worth updating.
Just the same, however, I do plan on implementing a feature that will eventually analyze all stocks, maybe once a month or once a week. You never know when the circumstances will change for any particular stock, especially the lesser known ones.
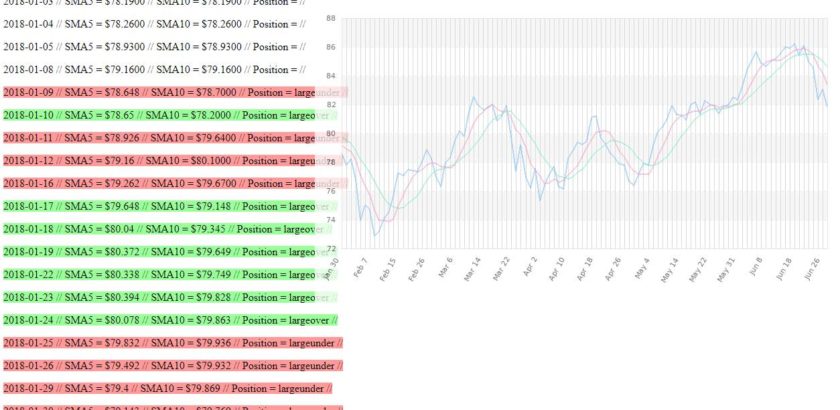
The big features I’ve recently added are simple moving average (SMA) functionality and chart generation. I’ve tried a few chart generating libraries, including Google Charts, but for now I’m sticking with Jpgraph. I really liked Google Charts but I hated that I have to set up the data in the HTML header before generating the chart itself where I want it on the webpage. Plus, it doesn’t work offline. Jpgraph is kind of difficult for a newb programmer but I’ve gotten it to achieve what I need for now (check out the screenshot above). We’ll see how that goes.
The human factor
My program scores all stocks on a scale of 0 to 100. Because I’m mostly only working with historical price data from this year, which is not much go to by, I have a lot of stocks that are ranked at 100, which probably shouldn’t be (and as time goes on, many are dropped).
Because of this, I’ve had to do some manual analysis of my own to determine which stock will likely yield me the highest return for the lowest price from the list of “perfect” results my program provides. This may or may not be the cause behind my subpar paper trading so far. One thing I intend to do soon is to create a second portfolio and go back to my program’s results to “start over” and always choose the #1 result my program gives me. It’ll be interesting to see how that goes.
What’s next
Now that I’ve got SMA functions written and have been able to successfully apply the use of SMA triggers on individual stocks, I’ve got to wrap that up and make my program apply it using different time periods (5-day & 10-day SMAs, or 10-day & 20-day SMAs, etc.) to all the stocks in the market. Then do like I’m doing now, scoring and ranking them so I can begin paper-trading using this second method.
Hopefully, I can backtrack a month or so so I can simulate trading from the first day I started with the other method, so I can have side-by-side comparisons.
The ultimate goal, however, is to combine my current method with these SMA-triggers, which I’m hoping will yield more reliable stock picks.