The endgame is nigh! Well, the first endgame, anyways. If you know programming/coding, then you know you’re never really finished, there will always be bugs to squish and code to optimize or functions to update. But the first major “release” of my program is so damn close, I can taste it 😀 BTW, I’m not going to be actually releasing this software, as it’s highly experimental and subjective (not to mention unproven), I just don’t know what other term besides “release” to use for this type of milestone, where the program is effectively “useable”.
I’ve spent most of my free time this past week tweaking lines of code, applying quick-fixes followed by more thorough patches, modifying my database setup to account for crazy stock splits (1:30,000? WTF?). My price importer has seen almost no changes this week, which gives me hope that it’s where it needs to be and I can stop worrying about it (although there are a couple more things I want to try, more on that later). The bulk of my attention this week has been on the code that analyzes the entire market. The biggest change I’ve made was adding code that basically delists a stock if it sees too little activity to be effective, which helps reduce analysis time later on.
As of yesterday, the scanning portion, the real workhorse, is pretty much done as well. I’ve just integrated a couple things, such as the ability to easily scan the market at different date ranges (originally it only scans the last 2 years up to the current day). This comes in handy as I’m going to expand on my scoring system by using a weighted average score; I came to realize there is always the chance that some stock might consistently under- or overperform for an extended period of time, and suddenly do an about-face. For example, say XYZ started at $1,000 and after multiple losses, dropped to $500, scoring around -0.29; suddenly, in one trade, it recovers everything, and now scores 0.41. Technically, it’s broken even, but the score is like what other stocks that have made money would score; in essence, it’s kind of a false positive. So with a weighted final score I’d probably get a more realistic score of, say, -0.04 which can be interpreted as, “even though you’ve broken even, this stock is not very safe”.
This coming week will be a short one for the market, because of Thanksgiving, giving me less opportunity to live test and troubleshoot the analyzer code before doing another full-court press on the program the weekend after. But I feel I will have something useable and even presentable by this time next week.
One major part I’m disappointed with is the amount of time needed to download all my daily data. I’m at the mercy of my old and used server, my everyday home internet connection, and the API I’m downloading from. However, I’ve yet to reach their hourly call limit, which means if I can find some way, I can download more data faster. First thing I’m going to try is the most obvious (and also possible the least effective), which is to simply split my list of stocks in two, and run two instances of my downloader in parallel. I’m not dumb enough to expect double the download speed, but I’m hoping I’ll see some improvement; I’d be happy if it were just 10% faster, to be honest.
But so far, my program is yielding some interesting results. One surprising winner it’s pulled is Etsy, which makes sense, I believe it made good earnings with handmade pandemic goods. An even more surprising pick has been Avis Budget; yes, the rental car company. It got hit hard because of the pandemic, so I don’t know yet if my program did well after that drop, but it did triple it’s portfolio with it over the past 2 years. This is going purely off end results, I’ve yet to go through individual trades to see how or why it did what it did. But interesting picks nonetheless!
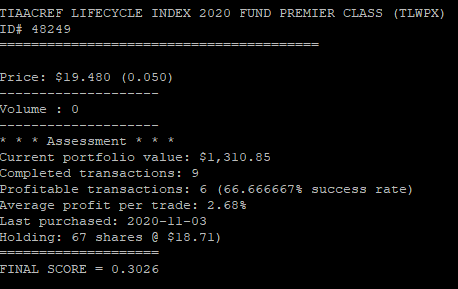
The screenshot above, by the way, is from my program, just a random stock analysis summary while it scanned the entire U.S. market 🙂 The last stage I’ll be starting this week will be to make a front-end, which will be web-based; just some HTML, CSS and back-end PHP to present everything in an easy-to-read, human readable format.
1 thought on “So close, I can taste it!”